Graphics
Graphics are supported by the class "TomasCollection".
The class contains all methods for the collection and
representation of data. Each instance of TomasCollection is used
for a series of (x,y)-values, where x normally represents time.
The series can be represented in three ways:
1. As a bar
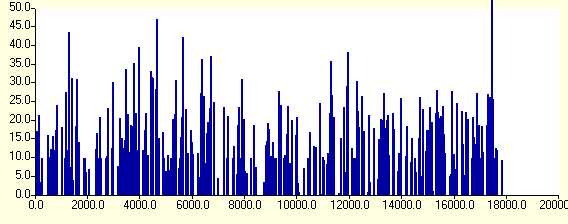
|
2. As a graph
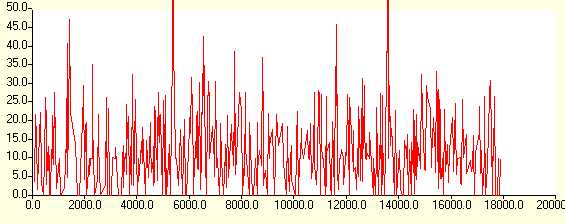
|
3. As a histogram
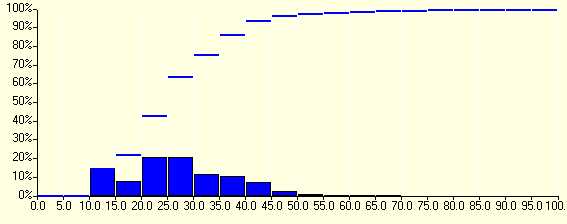
|
To support runtime inspection a GraphicsForm is available,
where all defined collections can be shown in the most suitable way
and can be saved to a CSV-file to support analysis afterwards.